ALD (Advanced Leak Detection) Dashboard
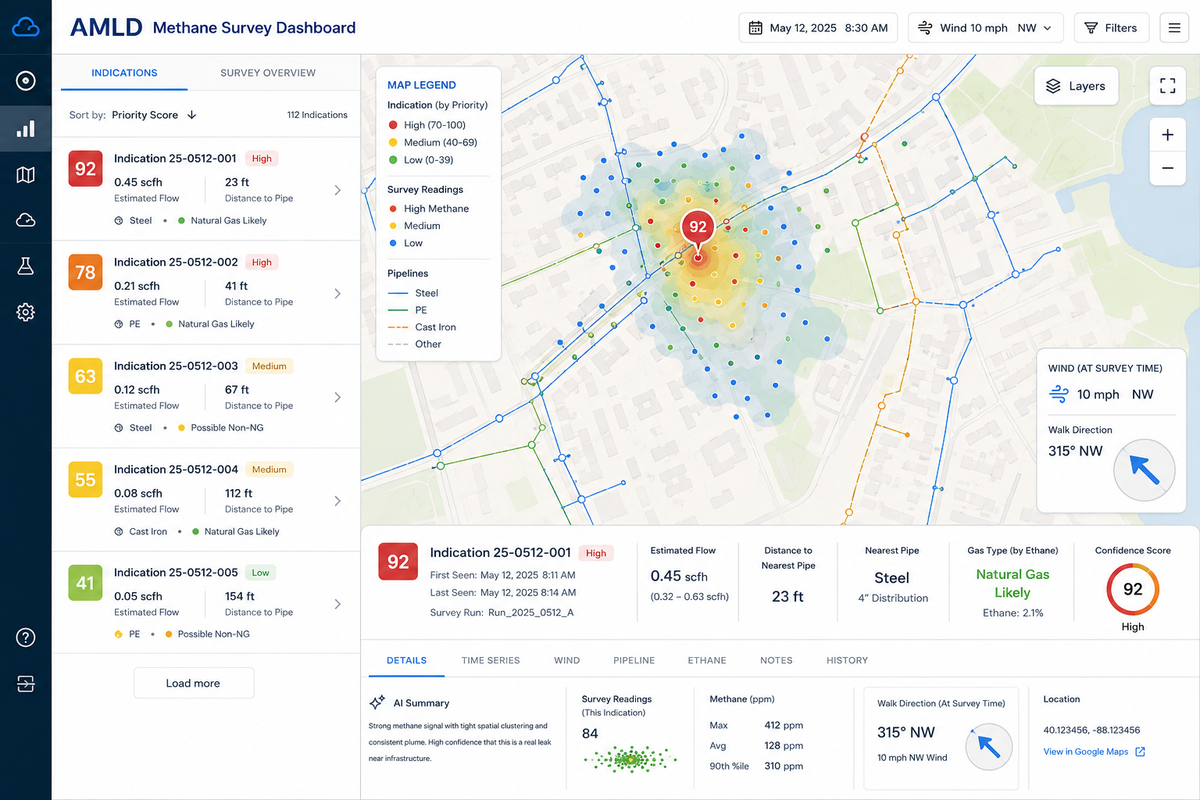
The ALD (Advanced Leak Detection) Methane Survey Dashboard turns raw methane survey data into a ranked, field-ready list of leak indications. The dashboard groups related readings into distinct events and scores each one for confidence, so a review team knows exactly where to look first.
Each flagged indication comes with what a field team needs to act on it: an estimated flow rate, distance to the nearest pipeline segment and its material, and a read on whether the source looks like natural gas or something else, based on ethane content. Pipeline data overlays directly on the survey map, so priority reflects both signal strength and proximity to real infrastructure.
When wind data is available, the dashboard even points a technician in the direction to walk to find the source. I use it as a testing ground. It lets me try new AI-assisted analysis techniques on real infrastructure data, and the same platform extends to other ALD (Advanced Leak Detection) technologies and survey types, not just AMLD.